In the distant past, in a time we called the 80s, there was only one input method for technical programs — the script. An input script is a text document with lines to set code options and parameters. Although infinitely superior to a stack of punch cards, people grew to hate them for several reasons:
- Each program had its own format conventions, with a multitude of options spread through a 100 page text document reproduced in a really bad font.
- The format conventions were rigid and the commands were often arranged with no thought to operational logic.
- Little errors would crash a run. There were no graphical tools to check input validity.
Despite the negatives, scripts have definite advantages over interactive graphical user interfaces:
- They provide automatic documentation of complex setups.
- It's easy to reconstruct solutions performed at an earlier time and to share setups with colleagues.
- When you really get to know a program, working directly with a script can be much more efficient than wandering through menus and dialogs.
To realize the advantages of scripts without the drawbacks, all Field Precision programs use the input method shown in Figure 1. A formatted text file forms a connection between a modern interface and the technical program. An experienced user can interact directly with the script, inspecting or modifying it with a text editor. This option provides a high degree of transparency.
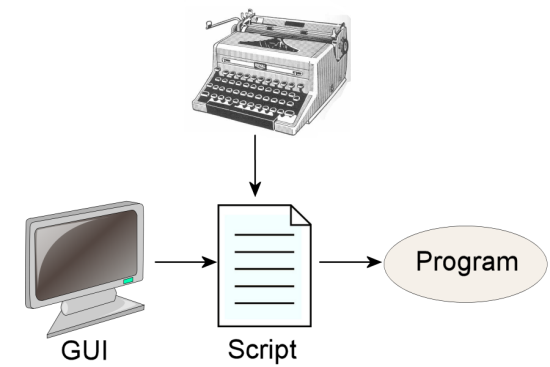
Figure 1.Data input to Field Precision programs.
A key advantage of scripts is evident when we recognize that the input source is not limited to a text editor. Information can easily be ported from Perl and Python scripts or user programs. This feature opens a wide range of options for parametric modeling and control loops.
In a recent consulting project, I was able to save considerable time by transferring spreadsheet information directly to the script of the Mesh program (the conformal mesh generator for two-dimensional solutions). Figure 2 shows the system geometry in z-r coordinates. The negative electrode of an electron gun is a cylinder of radius rc with a spherical tip. The sphere has radius rc and center at (z0,r0). The cathode is a conical section define by a line segment between (z2,r2) and (z3,r3). The average axial and radial coordinates of the emission surface (<z>, <r>) are constrained by the topology of an applied magnetic field. The total current I and source-limited current density js are also given quantities. The goal is to vary θ (the angular position of the emission surface on the tip) to achieve the best solution.
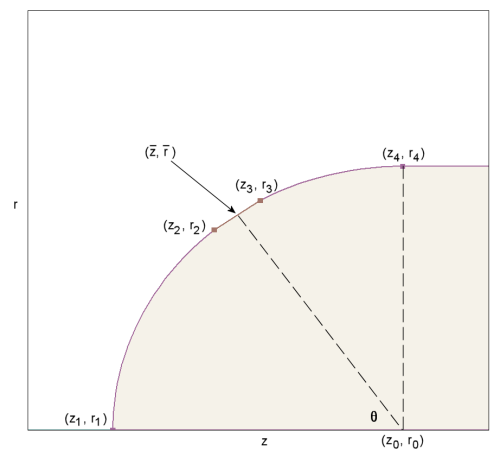
Figure 2. Definition of electrode coordinates.
The radius of the negative electrode is given by
rc = r/sin(θ)
The center point of the spherical-section arcs is
z0 = <z> + rc cos(θ),? r0 = 0.0.
The endpoint coordinates of the arcs are
z1 = z0 -rc,? r1 = 0.0,
z4 = z0, r4 = rc.
The endpoints of the line segment that define the conical emission surface depends on the surface area, equal to the total current I divided by the source-limited current density js. If the surface had an angular span ?? centered at ?, then the area is given by
As ? 2?? rc^2 sin(?) ?? = I/js.
With specified parameters, the equation can be solved to find ??. The coordinates of the emission surface are then given by
z2 = z0 - rc cos(? - ??/2),?? r2 = rc sin(?- ??/2),
z3 = z0 - rc cos(?+ ??/2),?? r3 = rc sin(? + ??/2).
For multiple solutions, calculating coordinates with a hand calculator and revising a CAD drawing would be quite inefficient. In long run, it is quicker to use a spreadsheet. The final figure shows a setup in LibreOfffice Calc. (With LibreOffice available for free, why would anyone use anything else? But that's another topic.) In the top section, input parameter cells are marked in blue. Cells marked in yellow contain the formulas to find the (z,r) coordinates. The bottom section contains text and formulas that define region vectors in Mesh format. A region definition starts with the REGION line with a descriptive name. The FILL string designates a closed, filled region. The following set of arc (A) or line (L) vectors outlines the region boundary. The regions included in the spreadsheet have vector coordinates that are affected by the cathode shape (orange cells).
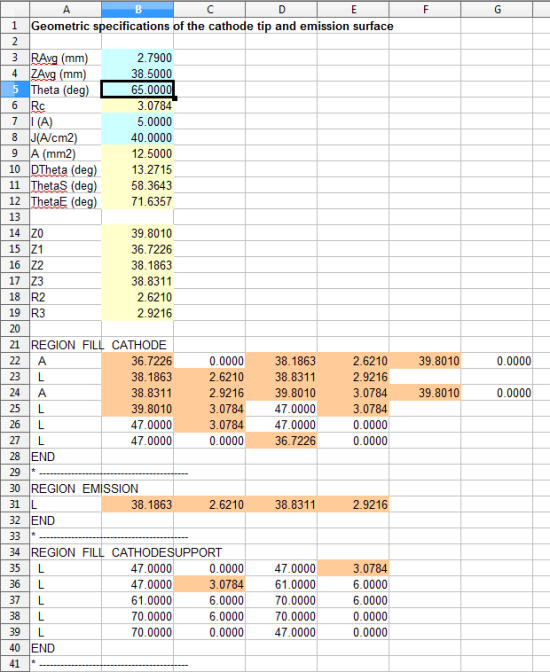
Figure 3. Spreadsheet to calculate coordinates and create region definitions for Mesh
To make a data run, I changed one or more values in the blue boxes, copied the lower section into the clipboard and then pasted the text into the Mesh input file. I then launched a small batch file to run Mesh, EStat and TriComp in sequence. With this arrangement, each data point took only a couple minutes. For applications with a large number of data points, the entire sequence could coded in a Python script for complete automation.
LINKS
