A customer recently asked about color-coding particle trajectories in Trak and OmniView. He wanted to start particles from an input list (PRT) and to plot trajectories with colors determined by the injection kinetic energy. This is a fairly tall order, but I came up with a procedure for plotting up to three classes of particles using the existing features of the codes.
The strategy is to use the plot filter capability built into Trak and OmniView. Figure 1 shows the filter dialog. Depending on minimum and maximum settings of quantities, model particles may be divided into three classes with trajectory plots in blue, red and green. The problem is that the allowed filtering variables are the model particle current, charge and mass.
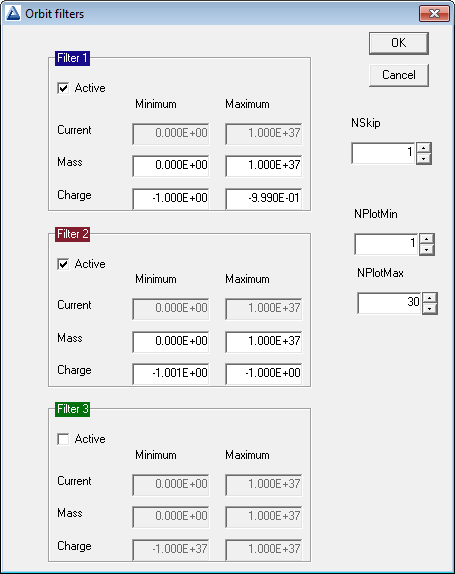
Figure 1. Filter dialog in Trak.
A simple solution is to introduce small changes of the filtered allowed quantities in the PRT file or Trak script that correlate with the desired properties. To illustrate, here is a sample PLIST input section from a Trak script:
PLIST
* Mass Chrg KEng x y z px py pz
* =========================================================
   0.0 -0.99999 10.0E3 0.00 0.00 -2.499 0.00 0.00 1.00
   0.0 -0.99999 10.0E3 0.05 0.00 -2.499 0.00 0.00 1.00
   ...
   0.0 -0.99999 10.0E3 0.65 0.00 -2.499 0.00 0.00 1.00
   0.0 -0.99999 10.0E3 0.70 0.00 -2.499 0.00 0.00 1.00
* =========================================================
   0.0 -1.00001 12.0E3 0.00 0.00 -2.499 0.00 0.00 1.00
   0.0 -1.00001 12.0E3 0.05 0.00 -2.499 0.00 0.00 1.00
   ...
   0.0 -1.00001 12.0E3 0.65 0.00 -2.499 0.00 0.00 1.00
   0.0 -1.00001 12.0E3 0.70 0.00 -2.499 0.00 0.00 1.00
ENDLIST
Electrons with kinetic energy 10.0 keV have charge q = -0.99999*qe and those with kinetic energy 12.0 keV have q = -1.00001*qe. The charge difference is small enough to have a negligible effect on the trajectories, but large enough to be detected by the filter. Figure 1 shows the settings used to create the trajectory plot of Fig. 2. Note that the 10.0 keV electrons are shown in blue and the 12.0 keV electrons in red.
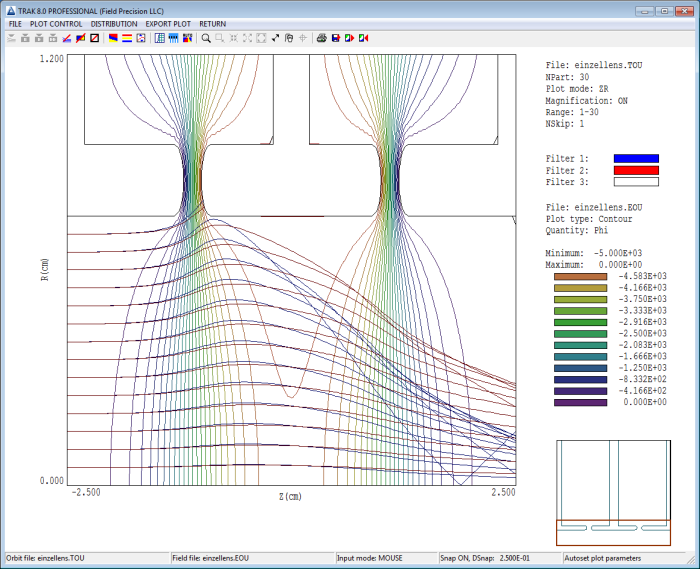
Figure 2. Trajectory plot with color-coding by injection energy.
LINKS
