A recent consulting project involved Xenos simulations of an intense, non-circular electron beam striking a graphite beam stop. A phosphor plate on the downstream face of the target was used as a diagnostic. The researchers wanted to know how the shape of the phosphor response correlated with the shape of the beam. One option was to add the phosphor plate as a region in a GamBet simulation and then to plot dose distribution as a slice plot in GBView3.
For the design of other diagnostics, the researchers wanted the spatial distribution of the X-ray flux emitted from the target. Such plots could be created using the GenDist utility program from information in the GamBet escape file. The escape file is a record of parameters for all particles leaving the solution volume. GenDist is a general-purpose program to create and to analyze large distributions of particles (e.g., electrons, ions, photons, positrons). For the application, the procedure was to load the escape file into GenDist and then to add filters that admit only photons at the exit face (i.e., z coordinate great than or equal to the exit face position). Of the GenDist plot types, the 2D histogram was appropriate for the application. Here, particles are assigned to a 2D matrix of bins according to their position in the x-y plane. The probability function N(x,y) may be weighted by the model particle current, energy or combined current/energy. In this way, the program can generate spatial distributions of the following quantities:
- Model particle density.
- Particle flux (weighted by model-particle current or flux).
- Power flux (weighted by model-particle current and kinetic energy).
The previous version of GenDist had only one available style for 2D histograms — a projected 3D view showing N(x,y) as height above the x-y plane. Although the style gave attractive plots for presentations, it was not useful for quantitative work. We added the three new styles shown in the figure for better display of spatial particle distributions:
- The existing 3D bin height plot improved with color coding.
- A 3D plot with bin height displayed as an interpolated shape.
- A 2D contour line plot, showing surfaces of equal probability density.
- A 2D filled contour plot.
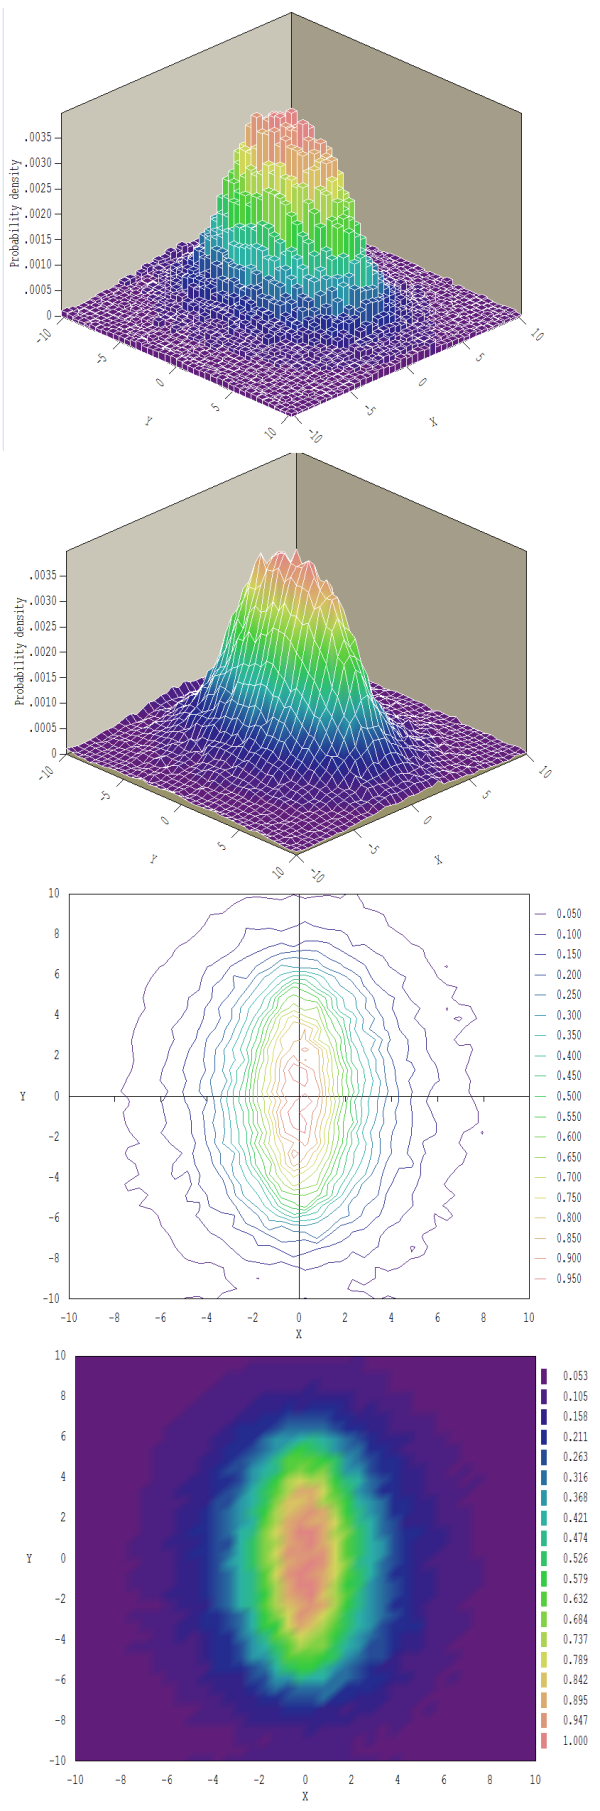
Plot styles for the 2D histogram type in GenDist
LINKS
